| G8 Countries |
 United
States of America United
States of America
|
 Europe Europe
Europe Celebrates! 50 Years of EU
|
 Germany Germany
26-Mar-2010
Innovation, education and more competition in the
domestic market would help Germany emerge from the
economic crisis with a stronger and more balanced
economy. Labor market policy should now pave the way for
necessary structural changes while fiscal policy needs a
specific exit strategy with focus on consolidating
public finances over the coming years.
|
 Japan Japan
|
 France France
|
 United
Kingdom United
Kingdom
|
 Italy Italy
|
 Canada Canada
- OECD
Economic Outlook No. 87 (May 2010 - English)
The economy is rebounding vigorously from the recession trough, helped by a recovering trade sector and policy measures. The pace of recovery is projected to moderate going forward as policy stimulus is ...
|
 Russia Russia
|
 China China
|
| Global Economics
- Viewpoints |
The Economic
Policy Institute, a nonprofit Washington D.C. think tank,
was created in 1986 to broaden the discussion about economic
policy to include the interests of low- and middle-income
workers. Today, with global competition expanding, wage
inequality rising, and the methods and nature of work changing
in fundamental ways, it is as crucial as ever that people who
work for a living have a voice in the economic discourse.
 Morgan Stanley's Global Economic Forum and Strategy
Bulletin:
Morgan Stanley's Global Economic Forum and Strategy
Bulletin:
November 9, 2010
Euroland:
Life on the Edge of the EFSF
Global:
Sense and Sustainability
United States:
Trade Tailwinds: Coming Strongly in 4Q
United States:
Review and Preview
Mexico:
Squeezed from Abroad
Argentina:
What's Next?
>>>
Archive
MFS Global Perspectives:
October 2010
Wells Fargo
Advisors Market Commentaries
For the Week of Nov 9, 2010:
|
World Markets - Technical
Analysis |
September 16, 2010: Euro/Yen
weakness points to stable markets
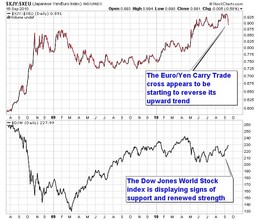 In
the September 9, 2010 Market Minute titled: US bond
yields and the S&P 500, technical evidence indicated
that 10-year yields were starting to rise. This data
is key because bond yields and the S&P 500 trade in
parallel patterns. Another signal of potential
equity stability is now coming from the currency
market. The Euro/Yen "Carry Trade" cross, which
trends in the opposite direction to global stock
markets, appears to be starting to rollover. This
currency cross has been advancing for over nine
months, and at the same time, the broad-based Dow
Jones World Stock Index (DJWSI) has maintained a
declining trend. The potential reversal of this
"Carry Trade" cross would imply an increasing
probability of favourable equity markets in Q4. In
the September 9, 2010 Market Minute titled: US bond
yields and the S&P 500, technical evidence indicated
that 10-year yields were starting to rise. This data
is key because bond yields and the S&P 500 trade in
parallel patterns. Another signal of potential
equity stability is now coming from the currency
market. The Euro/Yen "Carry Trade" cross, which
trends in the opposite direction to global stock
markets, appears to be starting to rollover. This
currency cross has been advancing for over nine
months, and at the same time, the broad-based Dow
Jones World Stock Index (DJWSI) has maintained a
declining trend. The potential reversal of this
"Carry Trade" cross would imply an increasing
probability of favourable equity markets in Q4.
But what is the "Carry Trade"? It is borrowing at
very low interest rates (near zero) in Yen and using
the loan to buy higher yielding assets elsewhere,
such as in Europe. During the past 12 years, the
trade has become standard business practice for many
institutional investors. Perhaps the most popular
form of the strategy exploits the recent yield gap
between European and Japanese fixed income
securities. However, as the Yen advances against the
Euro, the currency trade loses profitability which
in turn removes a source of capital from
institutional traders.
Bottom line: The Euro/Yen "Carry Trade" appears to
be in the early stage of reversing its nine month
upward trend. As the DJWSI has a tight opposite
correlation to the currency cross, this expected
action should be positive for the world stock
markets and increases the probability of a strong
performing 4th quarter.
Investment approach: Thought the outlook for equity
markets appears to be turning more favourable over
the mid-term, many world stock indexes are
overbought due the quick advance since early
September. Investors may wish to wait for an
expected retracement during the next 2 to 3 weeks
for better prices levels to develop.
More research on market conditions will be available
in the upcoming October newsletter.
Donald W. Dony, FCSI, MFTA
|
Archive |
|
Economic Analysis & Commentary |
|
|
| Reading |
-
IMF:
Reshaping the Global Economy
The economic and financial crisis marks the end (for
now) of a rapid expansion of globalization (March 2009)
-
Economics A-Z: Pareto efficiency? Phillips
Curve? Inflation? Deflation? Stagnation?
Look up
economic terms in this handy online resource, provided
by The Economist
|
|
| News & Commentaries |
|
Commodities
FTSE 100 ·
CAC 40 ·
Dax
·
MIBTEL
· IBEX
35 Index ·
Dow Jones STOXX
>
More European Indices
- Asian
Development Bank: ADB is an international
development finance institution whose mission is to help
its developing member countries reduce poverty and
improve the quality of life of their people.
-
The China
Perspective provides business-related information
with daily updates of major trends and developments in
the burgeoning Chinese economy, as well as a weekly
summary of the most pertinent issues in the foreign
press. $$$
-
The JapanInvestor
is dedicated to investors in Japanese stocks,
bonds and the yen. TJI provides a weekly strategic
analysis of Japanese stocks and financial markets,
providing you with views you can profitably use to
invest in Japan.
-
Asian Business Watch - A comprehensive source for
investment and economic information on Asia and Japan.
- Financial Times: Daily Update
-
CNNfn News: Asian Markets
- Macquarie Research: This Week in Asia
(pdf)
- StocksAbroad.com
- Resources for Investing in Asia and Latin America
Stocks
-
ValueNotes.com
- A complete directory and search engine for Indian
equity research, business, financial and stock market
information
- India:
Outlookindia.com
and
outlookmoney.com
-
Mizuho Securities
- Research and Links to English language resources on
the Japanese economy, finance, politics and law
-
The Edge
is
Malaysia's best selling and highly regarded
publication on business & investment.
-
Center for Asia
Investment Intelligence
- Economic and Financial Analysis with focus on
Japan and Korea
-
Australian
Stock Exchange data and information: Live Data
from the Australian Stock Exchange. ASX data, End of
day. Live, Dynamic. Australian economic news. Financial
& company news. Charts.
-
Sharetradingeducation: Home of
the Investing Online Newsletter & practical risk
management and tools. Download FREE TRIAL ISSUE and free
sample of Atkinson-Guppy Articles ebook of articles from
Daryl Guppy's newsletter, Atkinson portfolio tools &
Home Study courses on the work of Jim Berg, Daryl Guppy,
Alan Hull and Simon Sherwood.
All Ordinaries ·
Shanghai
Composite ·
Hang
Seng ·
BSE 30
·
Jakarta
Composite ·
KLSE
Composite ·
Nikkei 225 ·
NZSE
50 ·
Straits Times ·
Seoul
Composite ·
Taiwan Weighted ·
Headlines for these Markets
-
North American Stock Indices
-
Latin American Stock Indices
- InfoMoney focuses on providing
financial information about the Brazilian market.
News, stock quotes, technical and fundamental analysis
and interactive tools. (Portugese)
- Financial Times: Daily Update U.S.
Markets
-
Financial Chat
is home to the Internet's most sophisticated and
active real-time trading chatrooms. In our forums, we
have some of the world's finest traders with us daily,
willing to share information in real time, as well as
educate and assist you in your trading. Real traders
trading US and foreign markets, posting real-time
trades, and giving real-time market commentary.
- StocksAbroad.com
- Resources for Investing in Asia and Latin America
Stocks
MerVal
Argentina ·
Bovespa Brazil
·
S&P TSX
Composite ·
IPSA
Chile · IPC
Mexico · S&P
500 ·
DJIA
·
NASDAQ
·
Headlines for these Markets ·
·
Emerging Markets
Currencies
Major Currency Cross Rates
JPY
to USD
· EURO to USD ·
CAN $ to
USD ·
U.K. £
to USD ·
AU $ to
USD ·
CHF to
USD >
Currency Headlines |
Economies |
-
Principal Global Indicators (PGI)
A website that brings together data for the major economies available from international agencies covering the financial, governmental, external, and real sectors, and provides links to data in web sites of international and national agencies.
OECD Factbook 2009:
The online gateway to OECD Factbook PDFs,
Excel™ and interactive graphs. Access to the key
indicators for the World’s leading economies is only a
click away. To access all the contents free online,
click
here.
OECD Economic Outlook No. 87, May 2010
-
OECD Documentation: Statistics, Data and Indicators
Extensive economic statistics, data, and indicators from
member and non-member countries.
-
IMF World Economic Outlook (WEO) --
Crisis and Recovery - April 2010
-
IMF Economic Outlooks and IMF
Country Reports by Date
- Commerzbank Research:
Latest Economic Research
-
Global Business Cycle Indicators
- The Conference Board publishes leading,
coincident, and lagging indexes designed to signal peaks
and troughs in the business cycle for nine countries
around the world
-
Regional Economic Outlook: Europe
Date: October 2010
The recovery in Europe continues, supported by strong
policy action to contain sovereign debt problems in the
euro area. In advanced Europe, lingering uncertainties
and market pressures make for moderate and unequal
growth, creating challenges for macroeconomic and
financial sector policies. The REO also sheds light on
the governance issues revealed by the crisis, arguing
that better policy frameworks, in particular at the euro
area level, promise a stronger Europe. For the first
time, the REO devotes a separate chapter to the outlook
for emerging Europe, where, after a deep recession, an
export-led recovery is under way. However, the rebound
is uneven across the region, and policymakers face the
difficult challenge of dealing with the legacies of the
crisis, while not hurting the recovery. Beyond the short
term, the REO argues that the region will need to find
new growth engines, as the capital inflows-driven and
credit-fueled domestic demand boom needs to give way to
more balanced growth. Indeed, the REO emphasizes that
active fiscal policy and coordinated prudential measures
are key to avoiding a repeat of the boom-bust cycle the
region has just endured.
Español Français русский
-
Regional Economic Outlook: Asia and Pacific
Date: October 2010
One year after the deepest recession in recent history,
Asia is leading the global recovery. The Regional
Economic Outlook: Asia and Pacific discusses the
near-term outlook for the region, as well as the
medium-term policy challenges that countries face. As in
many emerging and developing markets, Asia rebounded
swiftly during 2009 and in the first quarter of 2010,
and in the near term the region is expected to continue
leading the global recovery. In the medium term, the
global crisis has highlighted the importance for Asia of
ensuring that private domestic demand becomes a more
prominent engine of growth.
中文 日本語
-
Regional Economic Outlook: Western Hemisphere
Date: October 2010
"Heating Up in the South, Cooler in the North" broadly
describes the economic scene for the Western Hemisphere.
The report emphasizes how a mixed environment--with slow
recovery in the United States and other advanced
economies, but strength in Asia--differently shapes the
outlooks for the diverse economies of Latin America and
the Caribbean. This issue also focuses on financial
issues in Latin America, with a chapter on the
challenges of allowing credit to expand safely, without
creating excessive risks, and a chapter that looks at
macroprudential financial policies--topics especially
important in today's context of low global interest
rates and capital flows to emerging economies. The final
chapter turns to Caribbean economies, exploring the
drivers, and obstacles, that affect their growth.
Español
-
Regional Economic Outlook: Middle East and
Central Asia region
Date: October 2010
The October 2010 Regional Economic Outlook: Middle East
and Central Asia reports on the regional implications of
the global economic recovery and presents key policy
challenges and recommendations. With the rebound in
crude oil prices and production, the oil-exporting
countries of the Middle East and North Africa will see
visible improvements in their fiscal and external
balances in 2010-11. Going forward, further efforts at
financial sector development and economic
diversification top the agenda. The region's
oil-importing countries, which include Afghanistan and
Pakistan, have weathered the global recession well.
Pakistan, however, suffered from devastating floods in
July/August, which will hold back growth this year. The
overriding longer-term challenges for these countries
are to raise growth and provide jobs for expanding
populations. In the Caucasus and Central Asia, recovery
has gained momentum in virtually all countries, aided by
the lagged effect of fiscal stimulus and a favorable
external environment. Exports are picking up, and
remittances are rebounding, though at a slowing pace.
Despite the broadly positive outlook, however, risks are
largely on the downside. A priority is to resolve
banking sector problems and, in some countries, to
reduce external debt and current account deficits.
-
Regional Economic Outlook: Sub-Saharan Africa
Date: October 2010
The October 2010 Regional Economic Outlook features: (i)
an overview of economic developments and prospects in
sub-Saharan Africa; (ii) an analytical assessment of how
monetary policy changes are transmitted through the
region's economies; and (iii) a study of why growth
rates in the West African Economic and Monetary Union
(WAEMU) have lagged behind other parts of sub-Saharan
Africa. The overview highlights the broad-based economic
recovery that is now under way in sub-Saharan Africa and
projects growth of 5 percent in 2010 and 5 1/2 percent
in 2011. It explores the resilience of most economies in
the region to the global financial crises of 2007-09 and
explains why sound economic policy implementation and a
growing orientation of trade toward Emerging Asia are
expected to continue to underpin growth. The second
chapter provides evidence suggesting that monetary
policy may have more power to influence monetary
conditions than previously assumed. Main messages from
the WAEMU study are the importance of strong policy
environments and political stability for achieving
sustained growth; and of robust fiscal frameworks for
directing resources towards priority spending needs.
Français
|
Get information to help you reach your
investing and
financial planning goals.
FOREX trading explained;
mortgage and
credit card help, too.
Visit
Financial Web

|
